Language: Português (BR) · Español
Comparison and evolution: seeing the athlete in the context of the race
Comparing athletes only makes sense with the same division and category filters. Evolution only makes sense with a consistent historical series. This page brings the two concepts together and points you to the right tools.
comparativo atletas tiro prático evolução atleta IPSC comparar hit factor gráfico radar análise desempenho
Open comparison now
Public form with Plotly on the home page.
Quick actions
Jump straight to import tools and related guides.
What you get on this page
- Side-by-side comparison (hit factor, time, points).
- Historical evolution by year and modality.
- Radar and correlation chart for competitive profile.
Quick summary
- Side-by-side comparison (hit factor, time, points).
- Historical evolution by year and modality.
- Radar and correlation chart for competitive profile.
- See the sections below and the shortcuts to apply to your test or transmission.
Comparison in the same test
The classic flow: select race, division and up to four athletes; generate PSBL graphs and tables. On the website, use /comparacao (main form). In the IPSC guide, /comparativo-atletas-ipsc and /como-comparar-atletas-ipsc-5-passos detail the step-by-step instructions in the IM hub.
Evolution over time
Filters by year, discipline and division feed into trend graphs — useful for seeing if changing equipment or training has changed average hit factor. APIs: /get_athletes_for_evolution, /generate_evolution_graph. Educational content at /analise-ipsc.
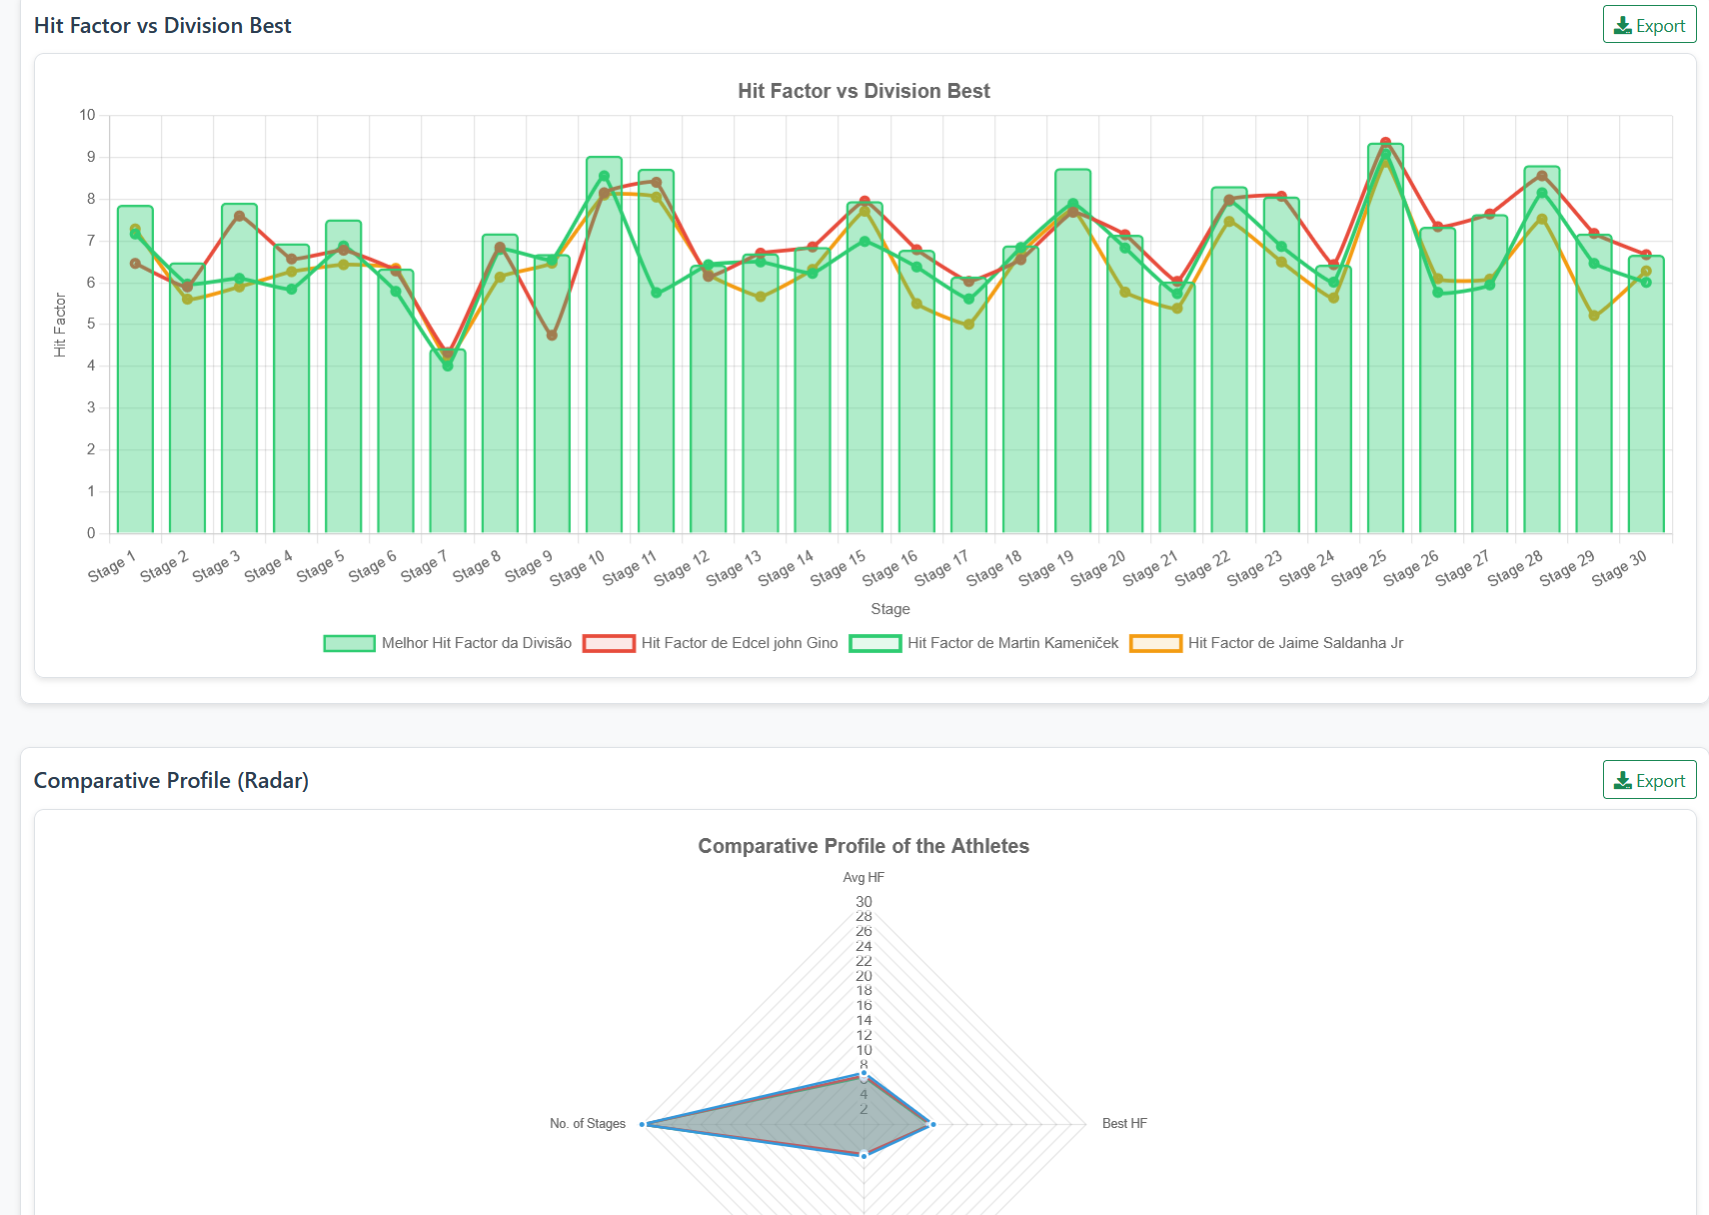
Radar and correlation
The radar graph summarizes dimensions (HF average, best worst track, consistency). Time×points correlation helps you see if you buy a score with risk. Pages: /grafico-radar-ipsc and /analise-correlacao-ipsc.
Performance Classified Details
After comparing, open /details-performance-atleta-ipsc for adaptive benchmarking and reading the performance classification in the chosen test.
Evolution vs snapshot of a test
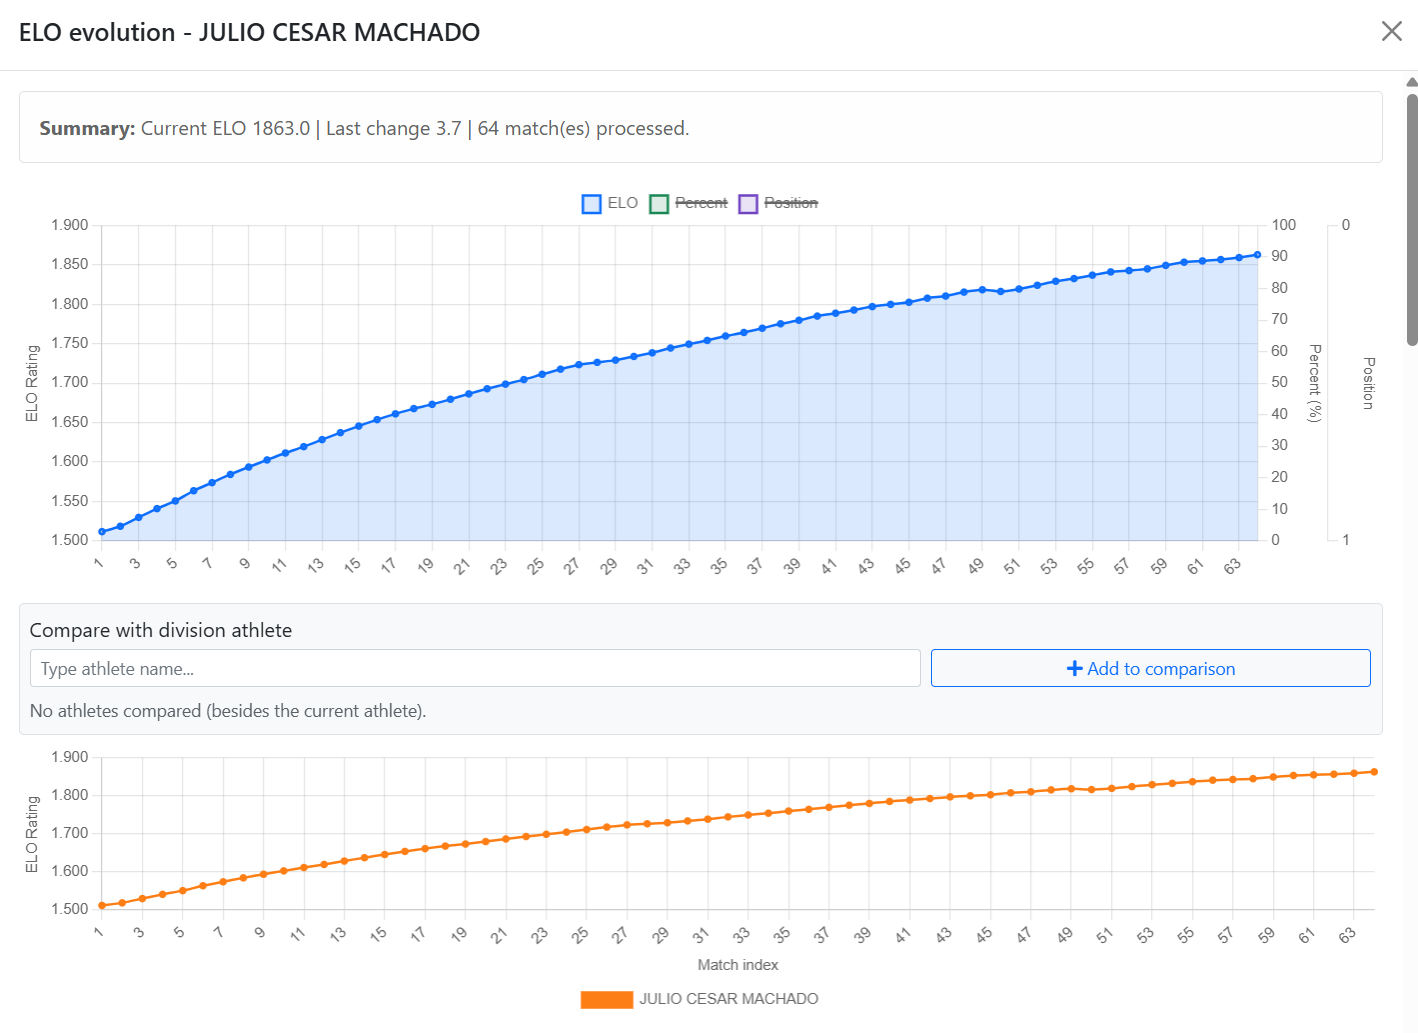
A test answers “how I was today”; evolution crosses several stages at https://im.scoring.services/atleta Combine with /ranking-elo-ipsc for level trending.
Evolution and comparison
Performance graphs and ELO ranking to track progress between tests.
Evolution and comparison
Performance graphs and ELO ranking to track progress between tests.
Evolution and comparison
Performance graphs and ELO ranking to track progress between tests.
Evolution and comparison
Performance graphs and ELO ranking to track progress between tests.
Tools on the IM hub
Direct links to im.scoring.services — match list, import, athlete search, editors, and more.
All hub features
Each card opens a dedicated area of the import and analysis hub.
More practical shooting & IPSC guides
Frequently asked questions
Apoiadores