Language: Português (BR) · Español
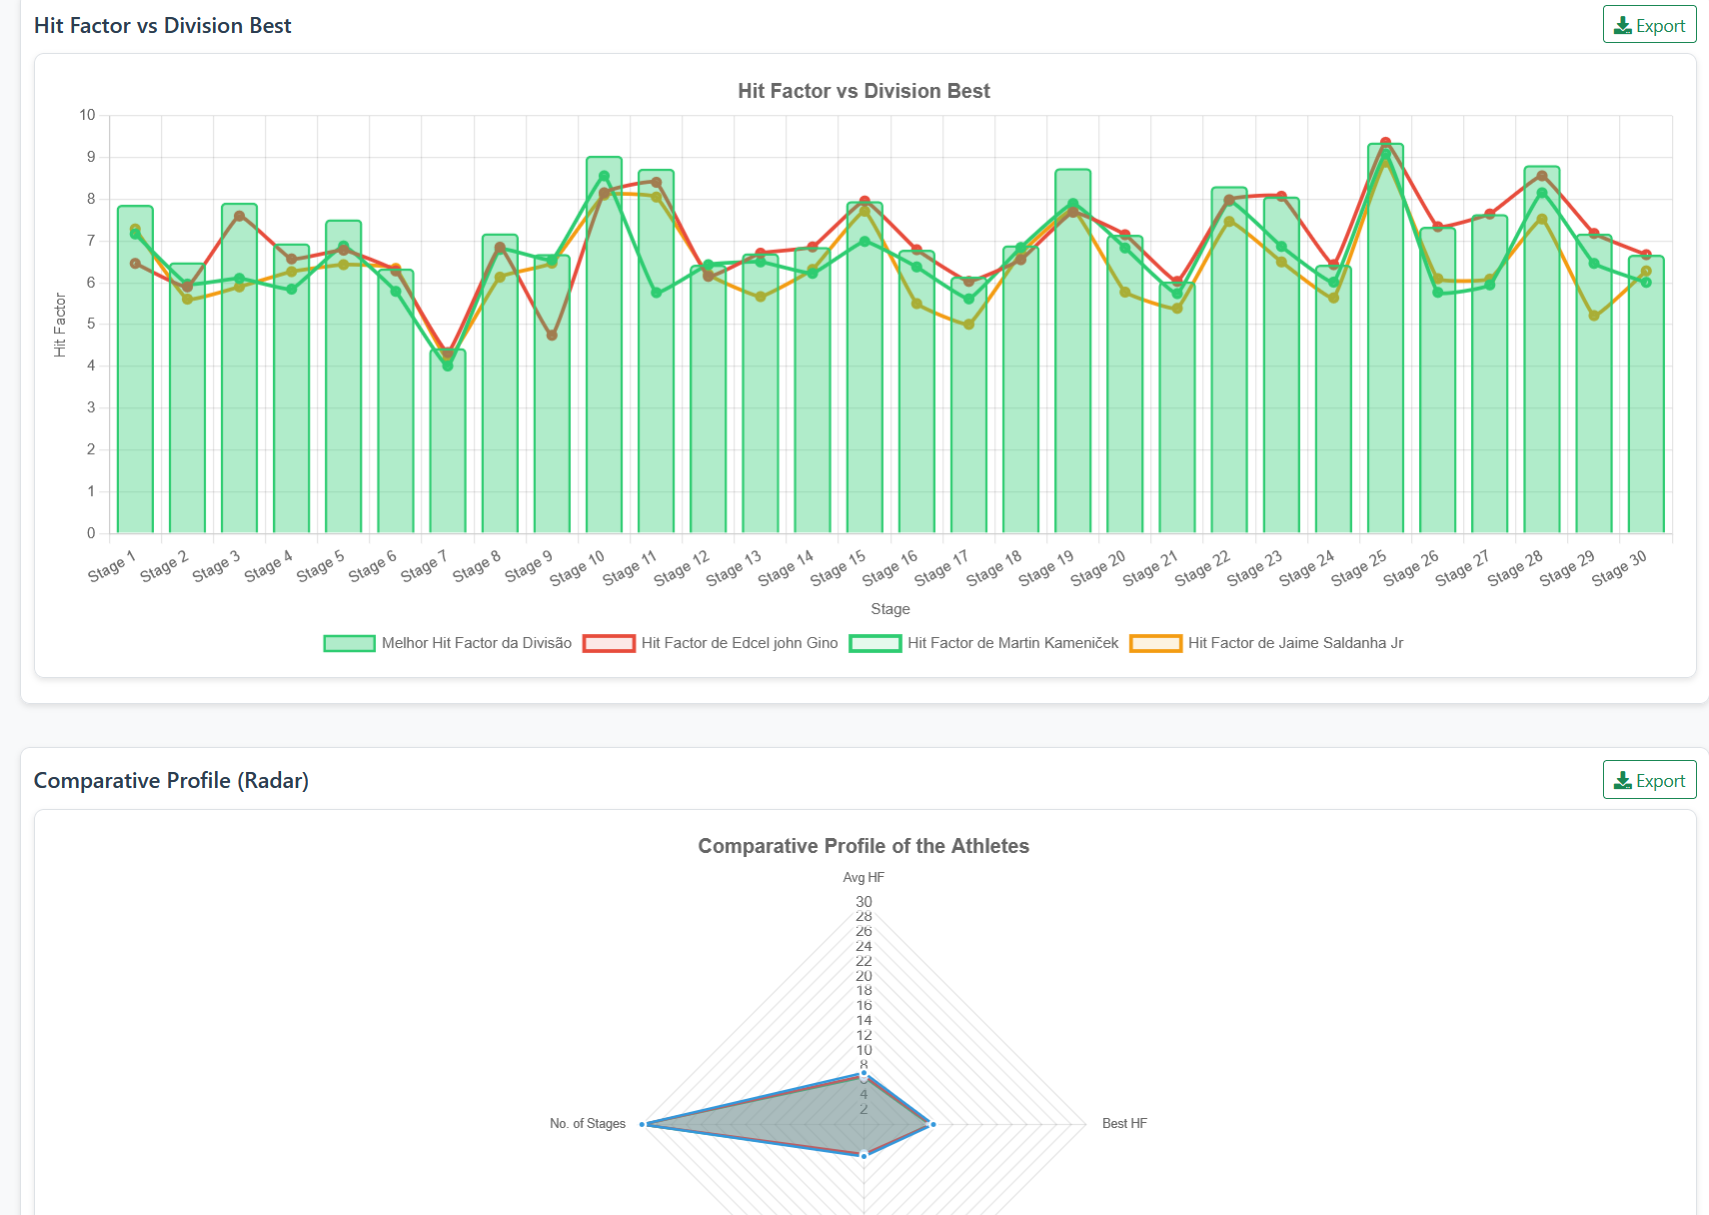
IPSC radar graph for competitive profile reading
The radar chart transforms several indicators into a single view of the athlete's profile, facilitating technical comparison.
gráfico radar ipsc perfil comparativo atleta média hit factor
IPSC Analysis Guide
See how to combine graphs, heatmaps and comparisons in the editorial flow of this site.
Quick actions
Jump straight to import tools and related guides.
Radar in the race hub
The radar is on the comparative graphs after selecting the race and athletes.
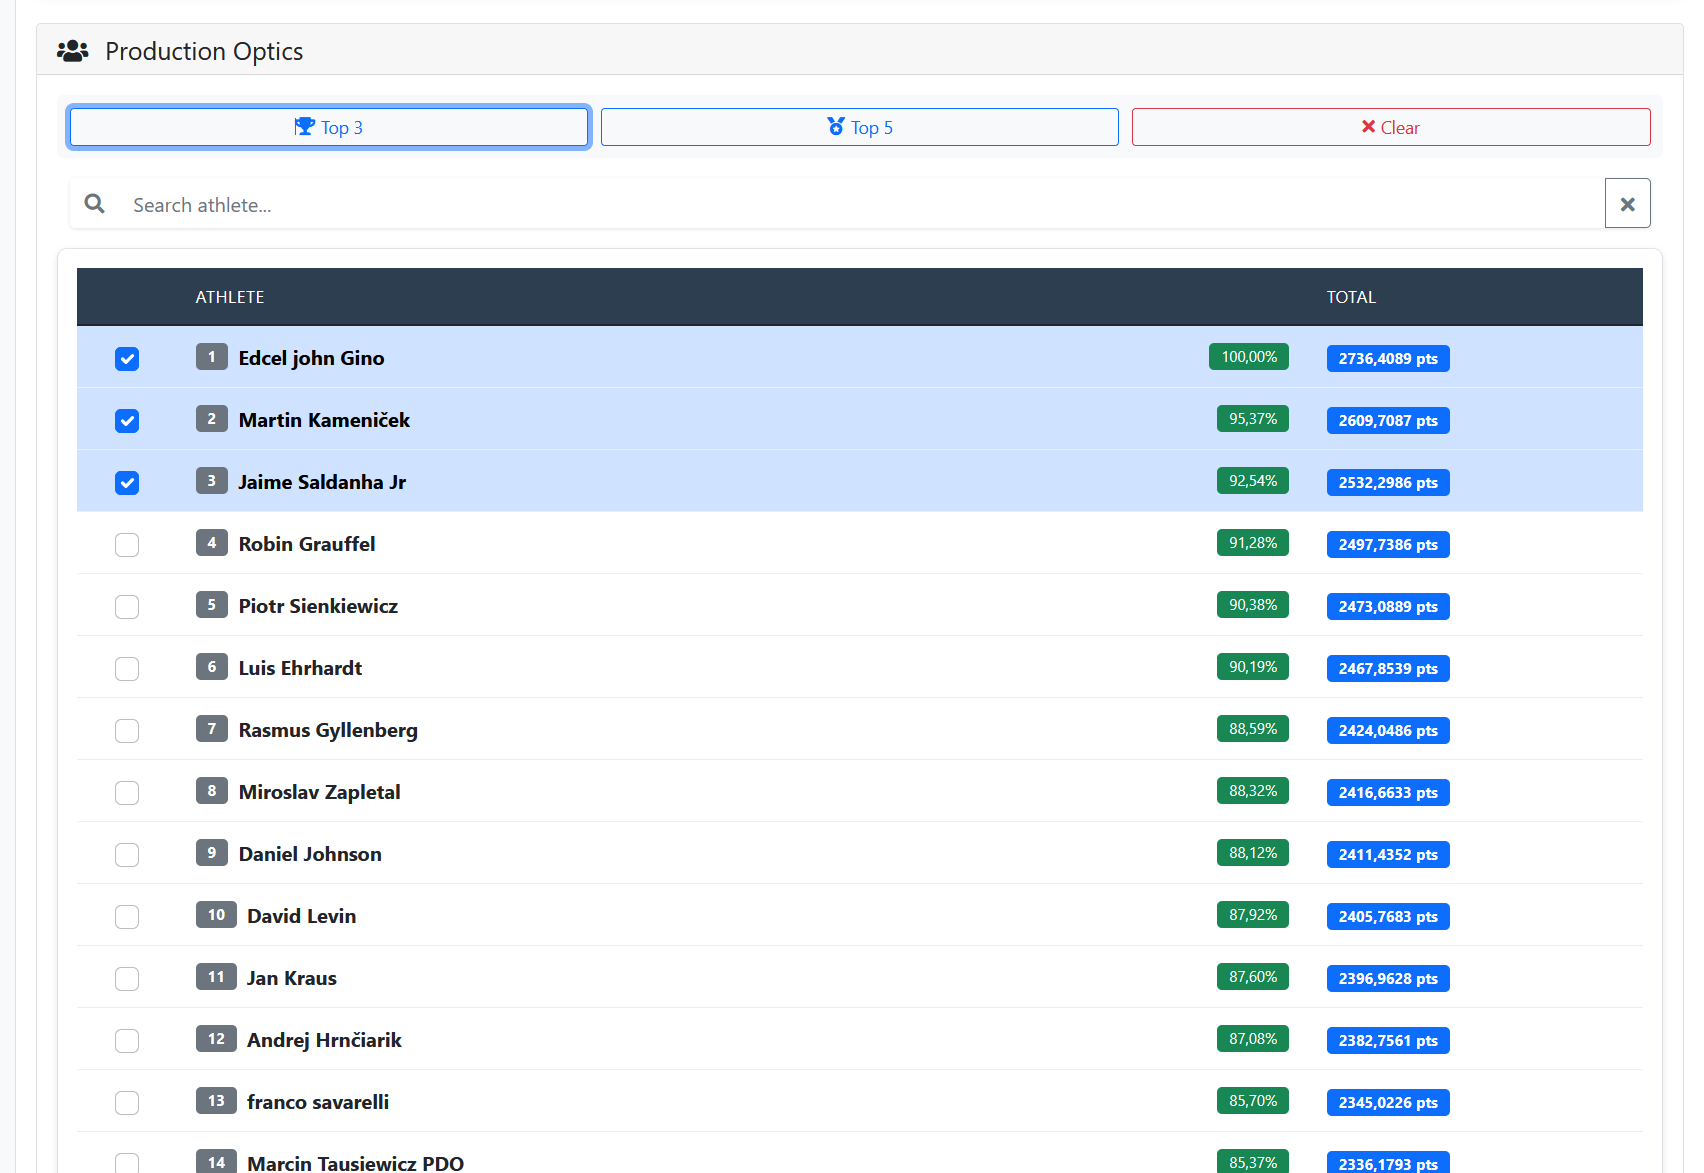
Go to evidence hubWhat you get on this page
- Visual performance profile in multiple dimensions.
- Clear comparison between consistency and peak performance.
- Quick read for athletes and coaches.
Quick summary
- Visual performance profile in multiple dimensions.
- Clear comparison between consistency and peak performance.
- Quick read for athletes and coaches.
- See the sections below and the shortcuts to apply to your test or transmission.
What the radar shows in practice
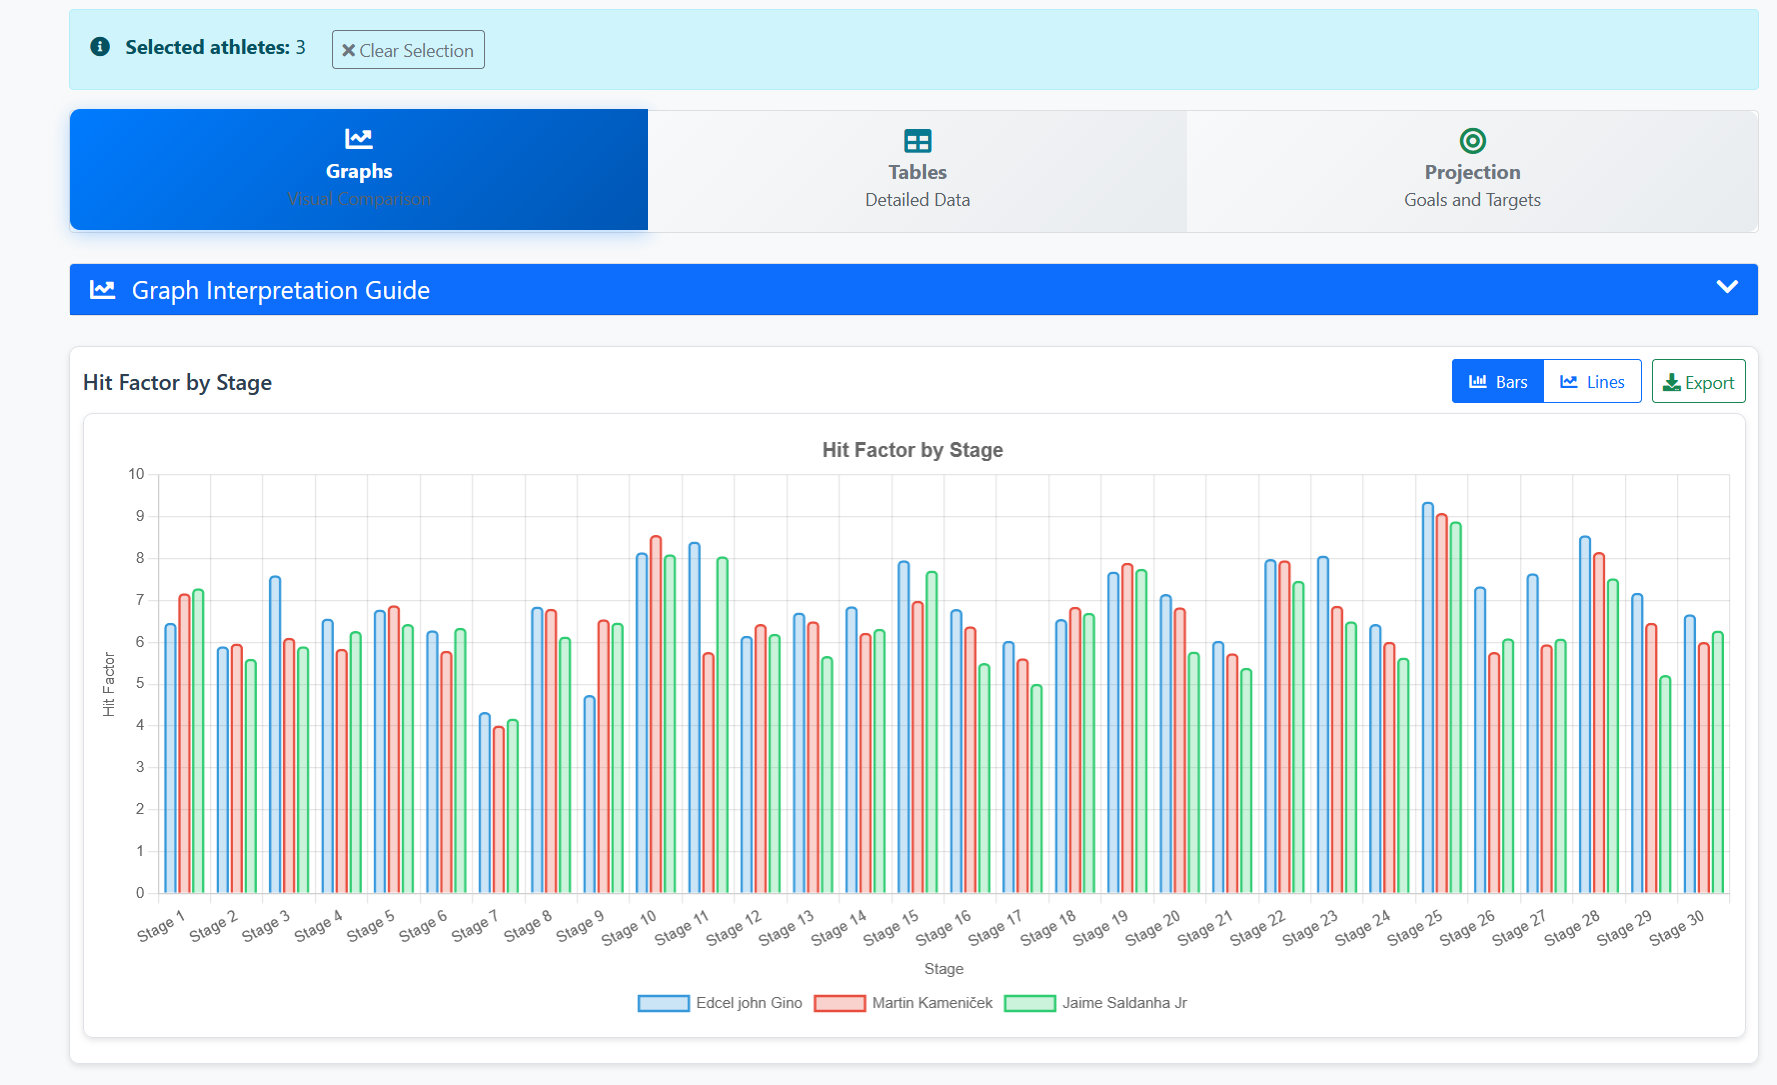
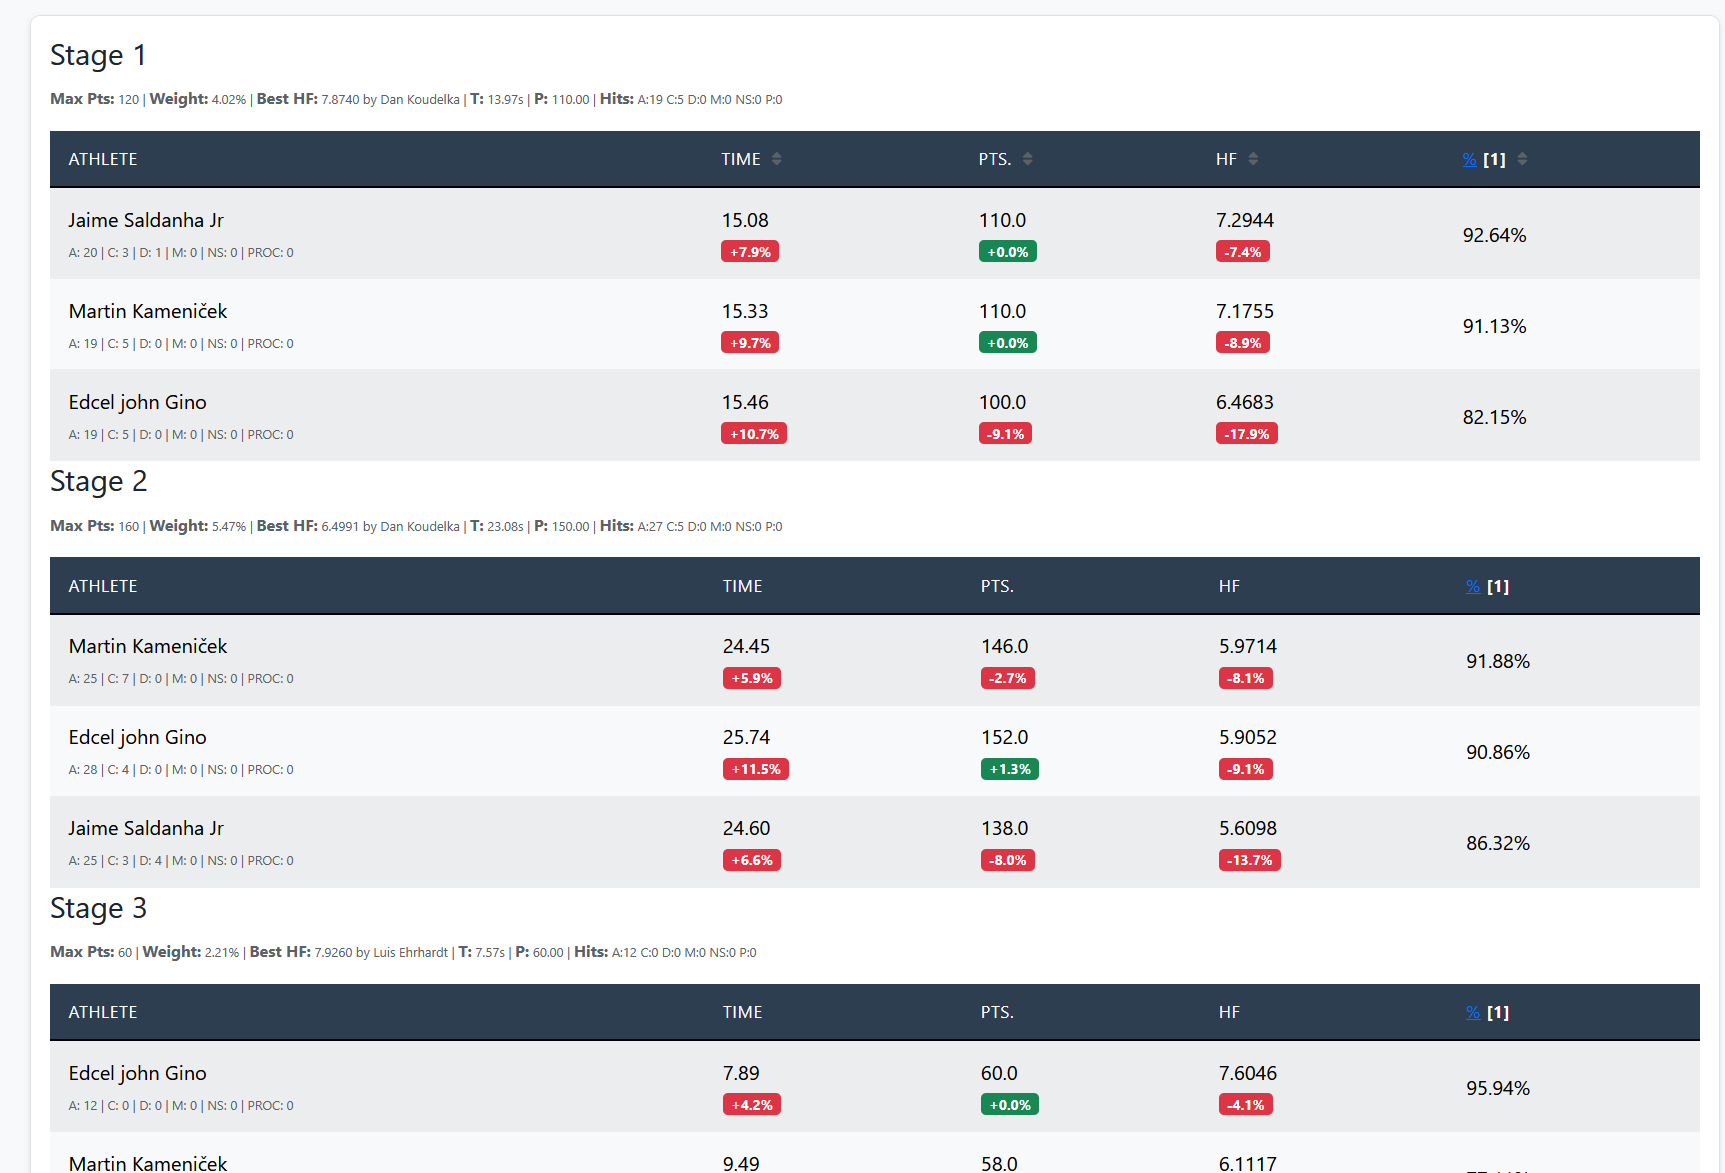
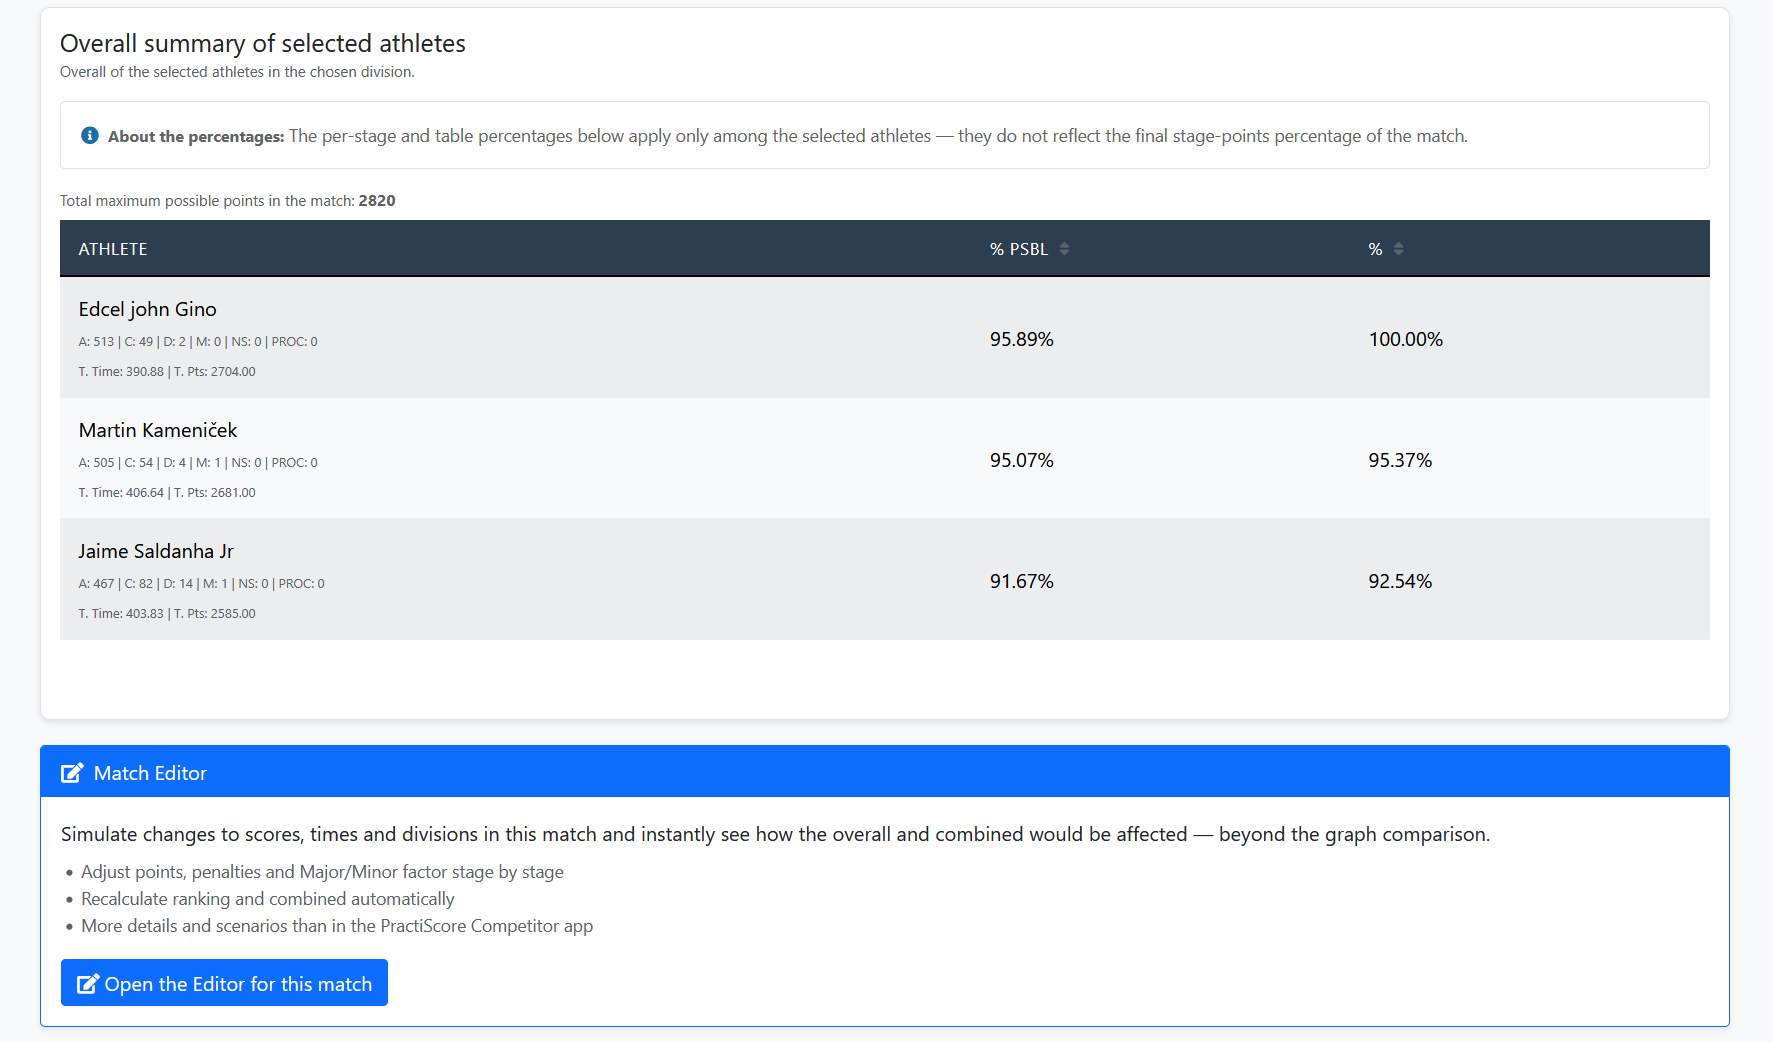
The radar graph aggregates, on different axes, the average hit factor (HF), best and worst HF between tracks and the number of stages — useful to see at a glance whether the athlete is stable (“closed” polygon) or depends on peaks in a few tracks (irregular shape). HF is points divided by time on the track, using the same criteria as the regulations applied to the race.
How to turn radar into action
Use the radar to identify imbalances: athlete with strong peaks and low consistency, or regular athlete without technical ceiling gain.
Practical value for evolution
Radar reading helps the athlete quickly identify performance patterns and prioritize adjustments based on real race data.
Continue in the Scoring Services ecosystem
This article is part of /guia-ipsc. To apply it in practice, open a test at https://im.scoring.services/list or follow the steps at /matches. Recreational athletes can start with the comprehensive guide at /tiro-practico-guide-completo.
Interpret the polygon
Irregular shape = dependence on few tracks; balanced polygon = consistency. Combine with /analise-correlacao-ipsc.
Comparative Charts
Select athletes and compare hit factor, time and points — bars, lines and radar profile.
Comparative Charts
Select athletes and compare hit factor, time and points — bars, lines and radar profile.
Comparative Charts
Select athletes and compare hit factor, time and points — bars, lines and radar profile.
Comparative Charts
Select athletes and compare hit factor, time and points — bars, lines and radar profile.
Tools on the IM hub
Direct links to im.scoring.services — match list, import, athlete search, editors, and more.
All hub features
Each card opens a dedicated area of the import and analysis hub.
Division statistics
Compare averages and distributions within the same IPSC division.
Athletes by divisionPlatform statistics
Distribution by division, state, match level and macro view of imported data.
Open platform statsIPSC Stage Designer
Draw stages in the browser — WSB, PDF, materials and RO link.
Open Stage DesignerExplore more in the IPSC guide
Frequently asked questions
Apoiadores