Language: Português (BR) · Español
Data-Driven IPSC Athlete Benchmarking
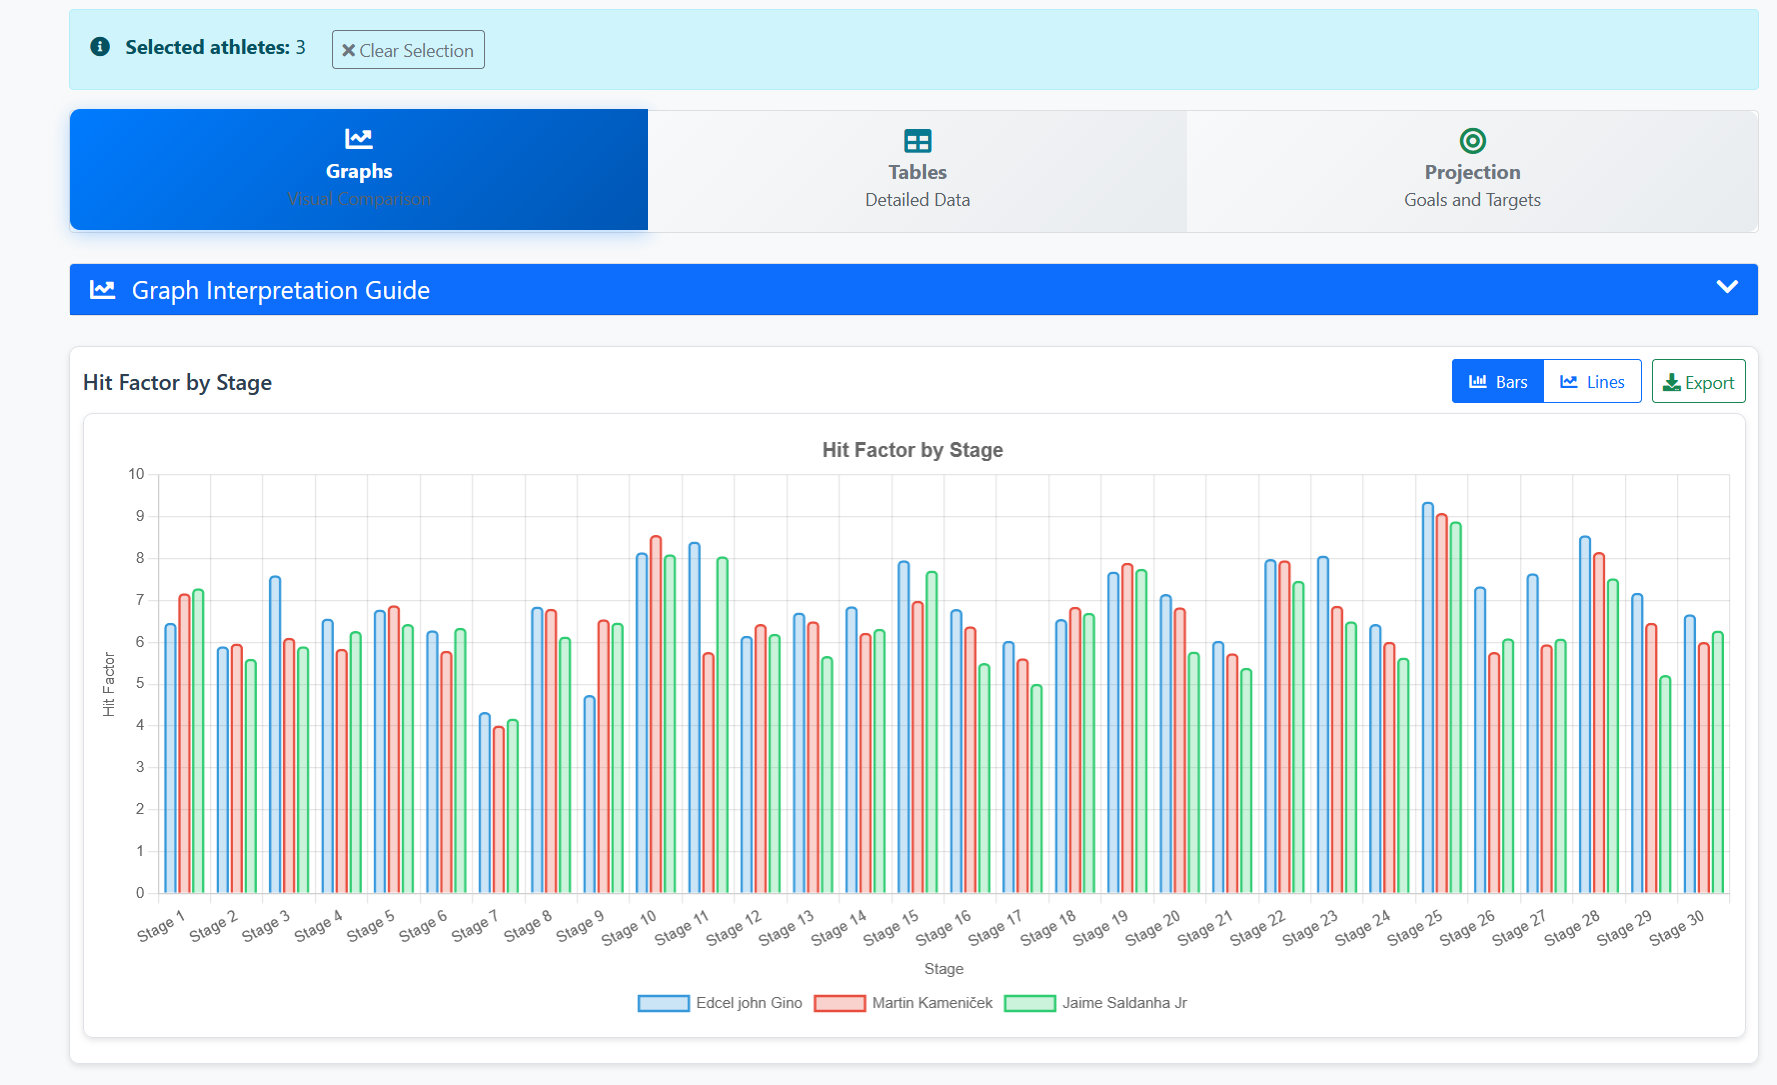
Based on the documentation flow, the comparison allows you to analyze up to 4 athletes in the same race with visual and technical reading.
comparativo atletas ipsc comparar atletas ipsc gráficos comparativos ipsc
Compare athletes in the IM hub
Select the race, open Charts and choose up to four athletes for comparison, radar and correlation.
Quick actions
Jump straight to import tools and related guides.
Deepen the comparison in the athlete's profile
After comparison, open the details page to see performance rating and adaptive benchmark.
Go to athlete details in the raceWhat you get on this page
- Simultaneous comparison of up to 4 athletes.
- Reading by hit factor, time and points per stage.
- Filters by division and category for fair analysis.
Quick summary
- Simultaneous comparison of up to 4 athletes.
- Reading by hit factor, time and points per stage.
- Filters by division and category for fair analysis.
- See the sections below and the shortcuts to apply to your test or transmission.
Recommended flow for comparing athletes
Enter the race hub, open Graphics, select division and choose athletes. The system automatically assembles the charts for side-by-side analysis.
How to use it on a daily basis during the test
The comparison provides immediate value: the athlete sees himself in the context of the race and clearly identifies where he can improve.
Advanced reading features
Hover tips (tooltips), changing the type of graph, interactive caption and image export (PNG) allow you to save the same view from the hub for the debrief with the coach or team after the race.
Continue in the Scoring Services ecosystem
This article is part of /guia-ipsc. To apply it in practice, open a test at https://im.scoring.services/list or follow the steps at /matches. Recreational athletes can start with the comprehensive guide at /tiro-practico-guide-completo.
Where to generate the comparison
In the test hub (graphics) or in the public form /comparacao. Summary profile: /grafico-radar-ipsc.
Compare athletes in the race
Same graphics interface as the hub — split selection and visual comparison.
Compare athletes in the race
Same graphics interface as the hub — split selection and visual comparison.
Compare athletes in the race
Same graphics interface as the hub — split selection and visual comparison.
Compare athletes in the race
Same graphics interface as the hub — split selection and visual comparison.
Tools on the IM hub
Direct links to im.scoring.services — match list, import, athlete search, editors, and more.
All hub features
Each card opens a dedicated area of the import and analysis hub.
Division statistics
Compare averages and distributions within the same IPSC division.
Athletes by divisionPlatform statistics
Distribution by division, state, match level and macro view of imported data.
Open platform statsIPSC Stage Designer
Draw stages in the browser — WSB, PDF, materials and RO link.
Open Stage DesignerExplore more in the IPSC guide
Frequently asked questions
Apoiadores